Grafana
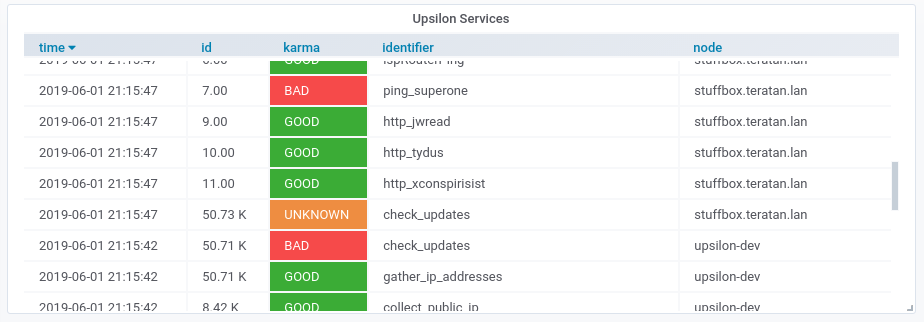
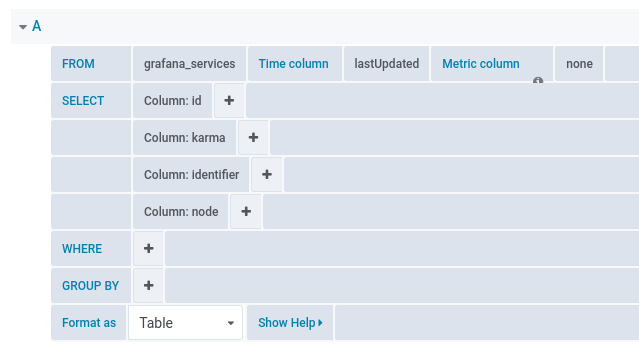
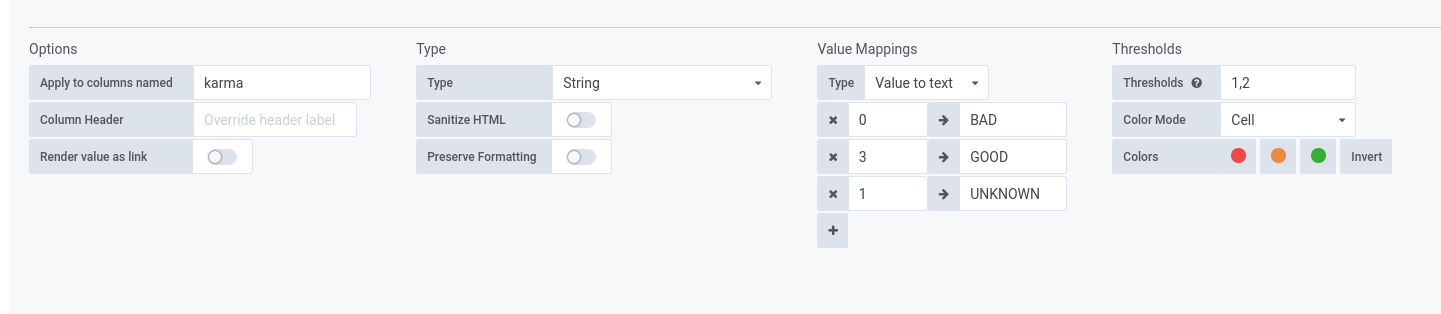
Grafana can quite happily read from the Upsilon MySQL database and show lots of information. The easiest way to probably do this is create a couple of SQL Views that make building Grafana queries a little easier.
Grafana can quite happily read from the Upsilon MySQL database and show lots of information. The easiest way to probably do this is create a couple of SQL Views that make building Grafana queries a little easier.